My experience scraping Disqus

To acquire data for my project mentioned here, I wanted to scrape the comments section of a norwegian newspaper.
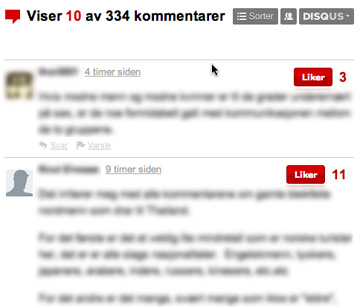
Disqus comments example
Comments at a norwegian newspaper based on Disqus

Initially I thought it would be as simple as getting the source and applying whatever regular expressions that would give me what I wanted. Sadly it was not that simple.

My chosen norwegian newspaper use Disqus as comment system. Disqus uses javascript quite heavily to generate HTML, this means that the comments are not part of the original source but just exist in the browser DOM. This problem can be solved by using “view generated source” in firefox developer plugin, or by making a plugin for a browser and manipulate the DOM directly. For my problem viewing the generated source was the simpler answer. If I wanted to scrape Disqus often I would make a plugin to dump the generated source.
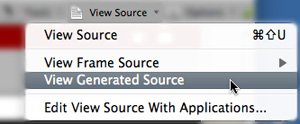
Firefox generated source
Showing generated source using firefox developer plugin.

Sadly this was not the only problem with scraping Disqus. Disqus is configured to only shows a small amount of comments at a time, and to show more a javascript routine must be invoked several times. I just did it a lot of times manually, though again if I really wanted to scrape Disqus based systems a lot, I would automate this step.

Once the I got the data I load it to a java routine which remove unwanted data based on regular expressions (it is faster to access the DOM, I would do that if I had lots of data). Then I generate descriptive parameters (word count, punctuation amount , etc) based on post content. The resulting parameters are stored as JSON. Then the resulting JSON is used as basis for the scatterplots here.

Adding interactive scatterplots to your website

To use the scatterplots presented in my previous post, this is what you need.

  • My scatterplot javascript code (LGPL) available for download here.
  • A dataset stored in JSON, with the structure explained below
  • Add .js files to HTML header
  • HTML canvas elements in your html
  • Assignment of data to axes and plots to canvas in javascript

Dataset structure

Datasets for use in my scatterplot code is structured as a JSON array named “dataArray” containing n maps. Each map contains n “name”:value pairs which each is considered a single datapoint. The values to be used in a scatterplot of course need to be numerical. An example of a valid dataset structure is shown below. This is all put in a .js file, and returned by a function named datasetForVisualization() as shown below.

//of course more data in a real dataset
datasetForVisualization() {
   return {"dataArray":
      [{"punctuationprword":2.0,"ekstrem":0.0"},
      {"punctuationprword":6.0,"ekstrem":0.0"},
      {"punctuationprword":0.1111111111111111,"ekstrem":0.0}]
}

Add .js files

To add the .js files to your page, add these tags inside your website:

<script src="data.js"></script>
<script src="geometry.js"></script>
<script src="guielements.js"></script>
<script src="selection.js"></script>
<script src="plots.js"></script>
<script src="dataset.js"></script>

HTML canvas elements

HTML5 canvas elements are created in the html parts of you website, and are created like this:

<canvas id="plot" width="640" height="480"><canvas>

The id parameter is needed since this is what you need to refer to when drawing to the canvas using javascript.

Assignment to canvas

The following javascript code will assign datasets parts to axes in the scatterplots, as well as tie the plot to a specific canvas and link with another scatterplot

<script type="text/javascript">
   //Select data for plot
   var data = create2DDataFromJson("punctuationprword","ekstrem");

   //Reference to canvas element created above
   var canvas = document.getElementById("plot");

   //Create plot
   var plot = new Scatterplot(canvas,data,540,400,
   "Punctuation pr word","Instances of ekstrem",false);

   //Link plot to other scatterplots
   plot.addLinked(plot2);
   plot2.addLinked(plot);
</script>

Hopefully this explains how to use the scatterplot as part of a webpage. To successfully use it within a WordPress blog is slightly more difficult. One of my next posts will go more into detail about that specifically. If you have any questions about usage please post a comment.